Data / ML project · Part 2 · Jul 2026
Does a bearing model transfer to a rig it has never seen?
Part 1 taught a model to predict failures on one test rig. The next
question: does any of that survive meeting a machine it has never
seen? It's the difference between knowing when your own car sounds
sick and diagnosing a stranger's truck. Every rig colors vibration
differently and lifetimes span 100× — 37 minutes to 45 days — so
this study pools three public run-to-failure datasets (NASA IMS
roller bearings, XJTU-SY and FEMTO ball bearings, 36 lifetimes),
converts remaining life into a fuel-gauge-style life fraction, and
measures the generalization gap directly: how much worse does the
model get when the entire rig — not just the bearing — is hidden
from training?
36run-to-failure bearings, 3 rigs, roller + ball, lifetimes 37 min to 45 days
≈ 0generalization gap: median life-fraction error 0.188 (bearing unseen) vs 0.169 (whole rig unseen), matched preprocessing
21.7×physics check passed: the BPFO envelope band lights up at a documented outer-race failure
−52%the hardest rig's late-stage error, once the cause was correctly diagnosed: 0.318 → 0.153
0.35worst single-bearing error — the number the median hides
Results
The gap is small. The reasons are interesting.
Six things this study establishes, stated plainly and up front. Each
one survived the corrections set out further down — where two
findings were revised, the revised number is the one quoted here.
- A rig it has never seen costs almost nothing. Hiding an entire test rig — not merely one bearing — moves the median error from 0.188 to 0.169. Whatever the model learned about damage is not rig-specific bookkeeping.
- The roller-versus-ball wall does not exist. Models trained only on ball bearings staged roller bearings at 0.168 — middling, not worst. Bearing type was not the dividing line; recording quality was.
- The odd rig out was helping. Removing the roller data makes ball-bearing predictions worse (0.190 → 0.200). Pooling unlike hardware paid off, which is not the default outcome — the failure mode has a name, negative transfer, and it didn't happen.
- The physics was verified before it was trusted. On a bearing documented to have died of an outer-race defect, the computed outer-race band rises 21.7× across the test while the inner-race and roller bands stay quiet. No envelope feature entered the model until that passed.
- It isn't quietly cheating. The easiest way to look clever here is to recognise which rig a snapshot came from, and the obvious tell is wall-clock degradation speed, which differs 100× between rigs. Those features carry 0.3% of the model's attention.
- The hardest rig got twice as good once the cause was found. FEMTO's late-stage error fell 0.318 → 0.153 — and the fix was the opposite of the obvious one, which is the subject of the correction section.
First, prove the physics feature works
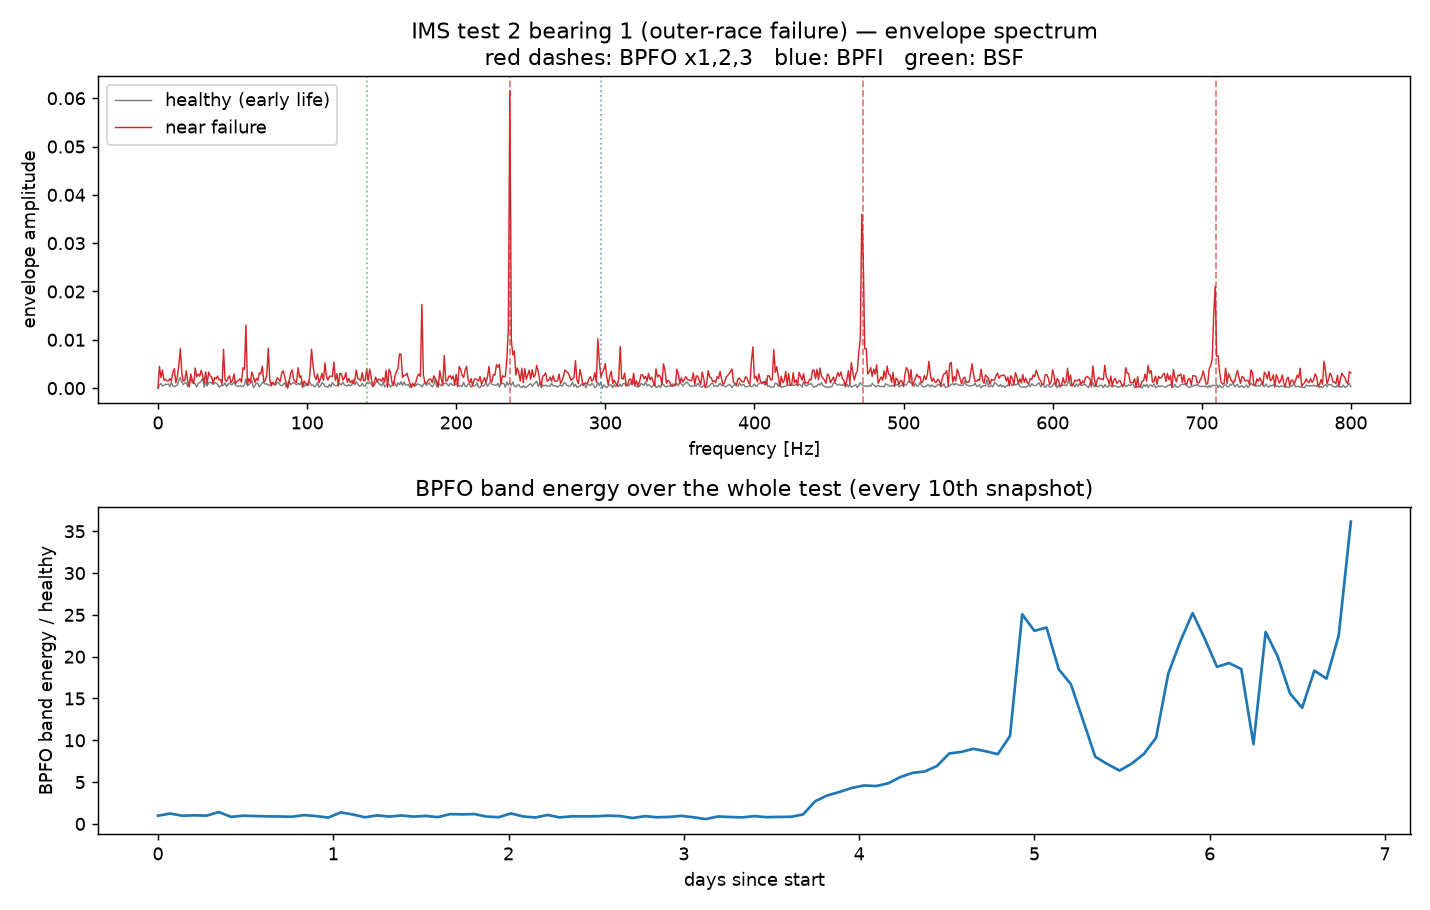
A unit test, but for physics. IMS test 2 bearing 1 died of a
documented outer-race defect, so its envelope spectrum must drum at
the computed outer-race tempo (BPFO, 236 Hz) and its harmonics —
and it does, sharply, while the inner-race and roller rhythms stay
silent. The drumbeat's energy grows 21.7× over the test. Only after
this check did envelope features enter the model.
The headline: bearing unseen vs whole rig unseen
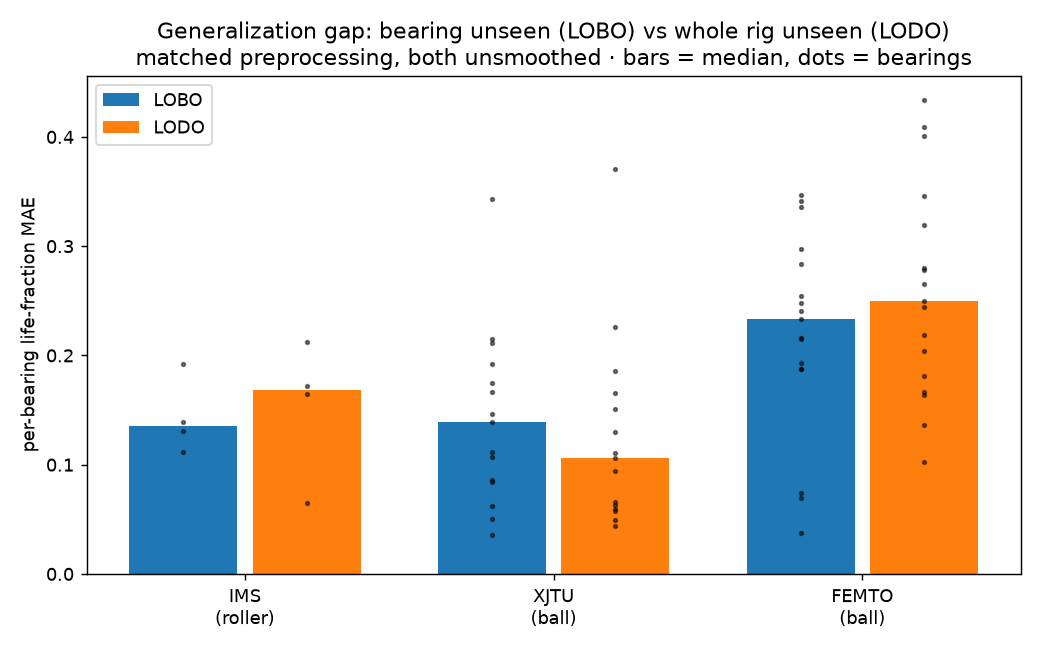
The headline: hiding the entire rig barely moves the median error
(0.188 → 0.169). Two surprises. The roller-vs-ball wall we expected
never showed up — models trained only on ball bearings handled the
roller rig fine (0.168). And the hardest dataset either way is
FEMTO, for a mundane reason: its snapshots last 0.1 seconds, so
every diagnosis is made from a finger-snap of audio. Recording
quality beat bearing-type physics as the dominant difficulty.
| Protocol | Median error | Late-stage (Q4) | Worst bearing |
|---|
| LOBO — bearing unseen | 0.188 | 0.121 | 0.347 |
| LODO — IMS (roller) held out | 0.168 | 0.160 | 0.212 |
| LODO — XJTU held out | 0.106 | 0.054 | 0.370 |
| LODO — FEMTO held out | 0.249 | 0.318 | 0.434 |
Both rows here share the same preprocessing on purpose. Comparing a
model that got a helping hand against one that didn't would measure
the helping hand, not generalization — so the gap is quoted on
like-for-like terms. That hand exists, and it improves the FEMTO row
substantially: late-stage error 0.318 → 0.153. It is kept out of
this table and set out separately in
Correction & review, along with the
explanation this page originally gave for FEMTO being hardest,
which turned out to be only half right.
Best, median — and the worst, on purpose
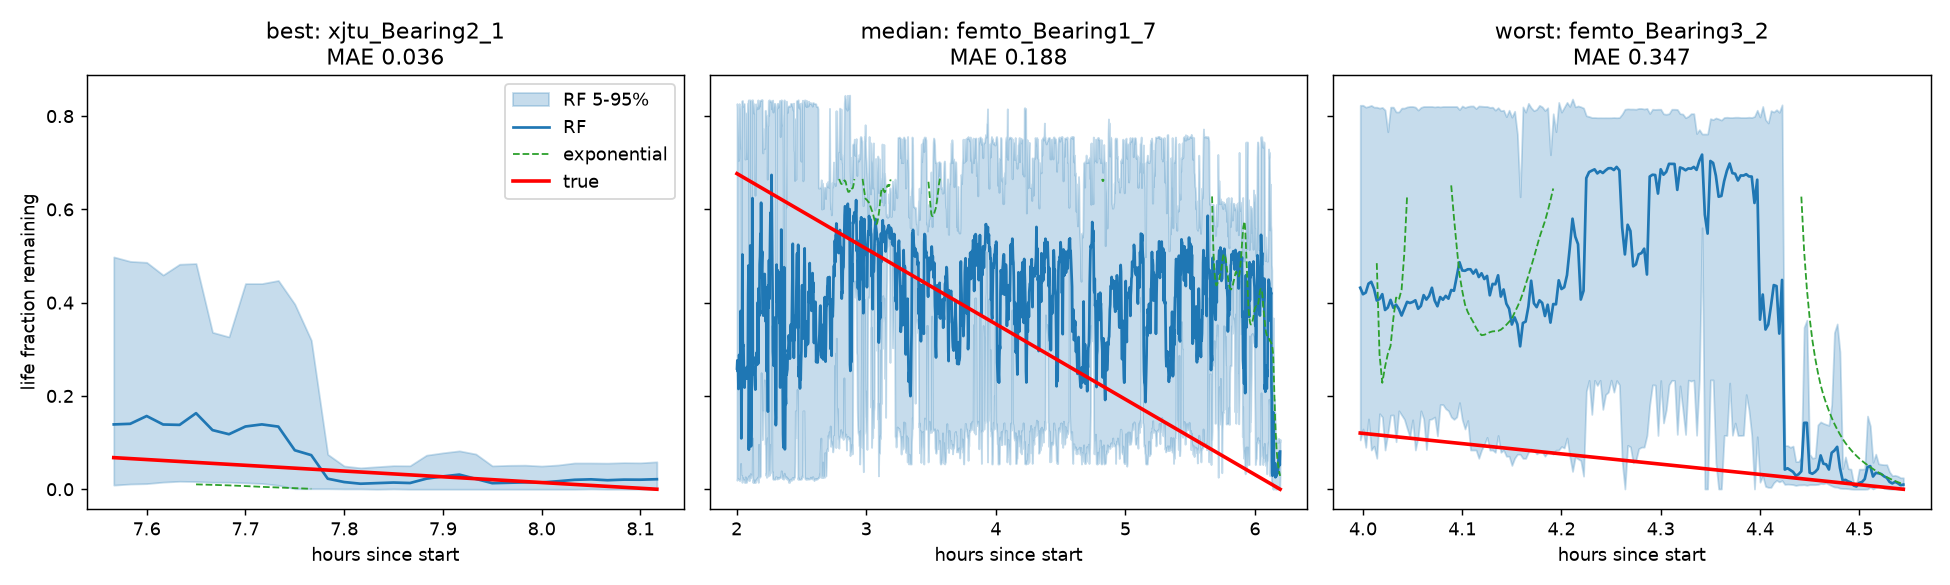
Predicted vs true life fraction; the shaded band is where 90% of
the forest's 300 trees land. Two things explain what you see.
First, the model has no memory — every snapshot gets a fresh
diagnosis, like a doctor working from a single blood test with
amnesia in between; that's the jitter. Second, mid-life is
genuinely ambiguous ("somewhat sick" looks the same at 30%, 50%
and 70% of life) while the end is unmistakable — so the band is
wide in the middle and snaps shut at the end. The best case is
partly an easy exam: its alarm fired at 93% of life, leaving only
the final, obvious stretch to track. The worst case is the honest
one, and it fails in the dangerous direction: the alarm fires late,
at 88% of life, and the model then reads the bearing as having
40–70% of its life left when barely a tenth remains. It only snaps
to the truth in the final minutes. An optimistic miss is
the one that hurts — a pessimistic model sends you to inspect a
healthy bearing, this one would have told you to keep running.
Don't over-read it, though: the second-worst bearing fails the
opposite way, flatlining near zero while most of its life
remained, and the two sit 0.004 apart. The model has no systematic
direction of error — it has two ways of being lost, and which one
tops the table is close to a coin toss. Medians hide bearings like
this; the report doesn't.
Curve extrapolation only answers the easy questions
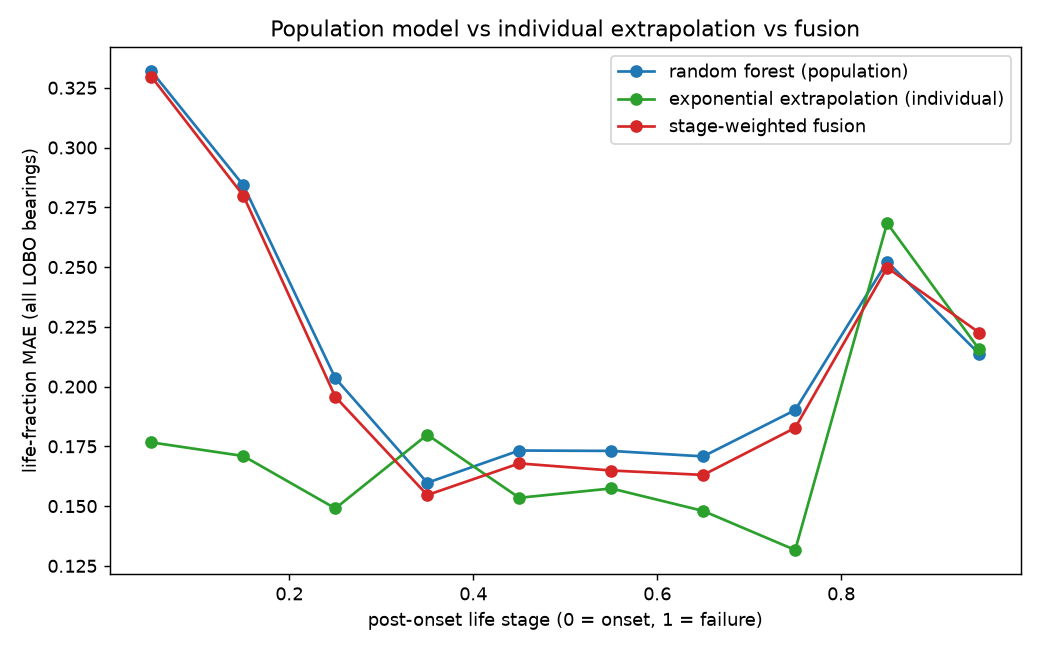
Literature says curve extrapolation fails early and shines late, so
the population model should win early and hand over the baton. Our
data refused the clean story — because the extrapolator is a
student who only answers the questions it's sure about: it only
forecasts when damage is actually growing exponentially (17–33% of
early snapshots), so its flattering early score is graded on a
self-picked easy subset. The forest answers every question, with
U-shaped error (worst right after onset). With 36 lifetimes we
report the curves and the coverage instead of declaring a
crossover.
Leakage guard: dataset identity carries 0.3% of the importance
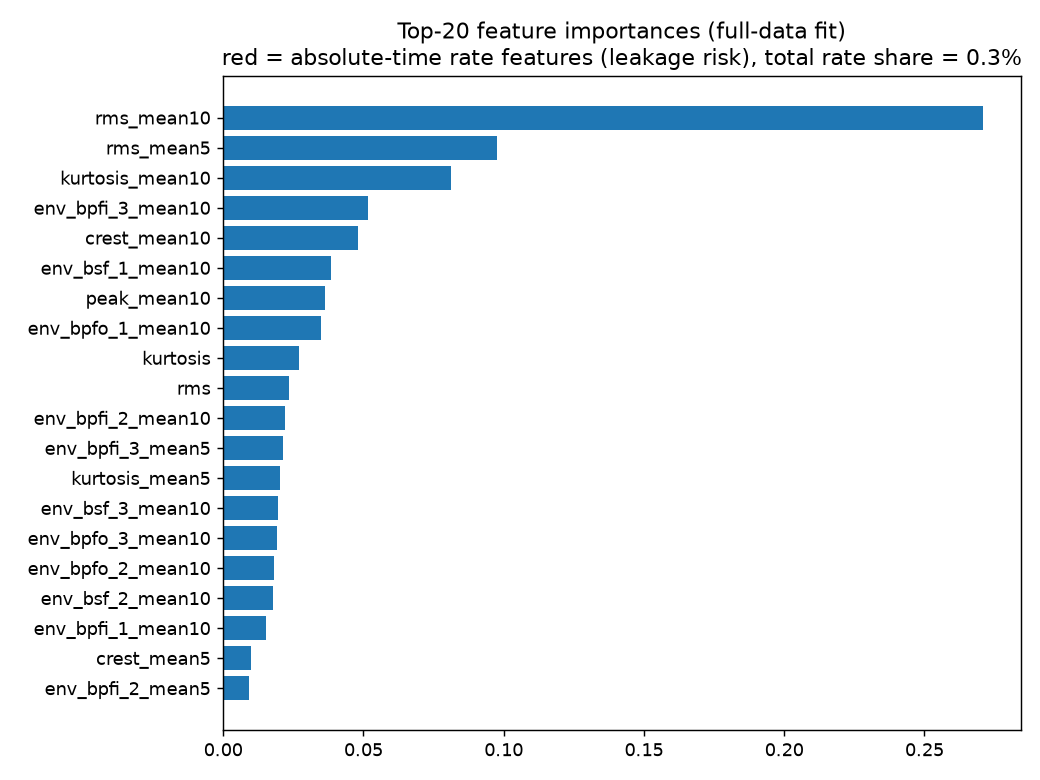
The cheating check. The easiest way to look smart here is to
recognize which dataset a snapshot came from — like grading exam
papers by recognizing the handwriting — and the obvious fingerprint
is wall-clock degradation speed, which differs 100× between rigs.
Those rate features carry 0.3% of total importance: the forest
leans on smoothed RMS (27%), smoothed kurtosis, and a broad spread
of geometry-derived envelope bands. Damage signals, not dataset
IDs. Two ablations complete the audit: removing the roller-bearing
data hurts ball-bearing predictions (0.190 → 0.200 — the
odd rig out was helping), and excluding cage-failure bearings
changes nothing (0.188 against a 0.190 baseline).
Correction & review
A second look halved the hardest rig's late-stage error — and overturned my explanation of why.
The results above were re-examined after publication. Two things
came out of it. A caveat about the FEMTO bearing's dimensions was
settled and turned out to be harmless. And the explanation this
page gave for FEMTO being the hardest rig — "its recordings are too
short" — was only half right, in a way that was hiding a fixable
flaw. Both are recorded here rather than quietly edited into the
tables above, because how a number moved is usually more
informative than where it landed.
DefinitionLife-fraction error
The model doesn't guess hours; it guesses what share of a
bearing's total life is still ahead of it. An error of 0.318 means
the guess is off by about a third of that bearing's entire life —
on a bearing that lives three hours, roughly an hour out. Lower is
better; 0 would be perfect.
DefinitionLate stage (Q4)
The final quarter of the bearing's decline — from the moment
damage is detected to the moment it fails, the last stretch. This
is the number that matters, because a prediction made while the
bearing is still nearly healthy is guesswork for any method,
whereas one made shortly before failure is what you would actually
schedule a repair around.
DefinitionTraining data
The worked examples the model learns from: other bearings that
already died, with their answers attached. Think of them as the
textbook cases a trainee studies before ever seeing a patient.
DefinitionTest data
The readings coming off the bearing being judged — a bearing from
a rig kept out of training entirely, so the model has never
encountered it or its siblings. The patient, not the textbook.
The dimension we had taken on trust — checked, and harmless
The fault rhythms this study listens for are computed from the
bearing's internal dimensions, so a wrong dimension means listening
at the wrong frequency. FEMTO's NSK 6804 figure had come from
secondary literature rather than the manufacturer. Pulling the
actual datasheet settled it: 13 balls and a 3.5 mm ball diameter
were right, but the ball centres sit on a 26.0 mm circle, not the
25.6 mm that had been assumed.
| Quantity | Published | Datasheet | Consequence |
|---|
| Ball circle diameter | 25.6 mm | 26.0 mm | assumption → verified |
| Ball-spin frequency | 1.6% low | corrected | 6 of 27 bands shift one step |
| Every result on this page | — | — | unchanged |
Recomputing the whole FEMTO dataset from raw signal moved only the
ball-spin features, left IMS and XJTU bit-for-bit identical, and
changed no conclusion. That is a boring outcome and worth publishing
anyway: "we checked and it didn't matter" is a different statement
from "we never checked."
Chasing the wrong cause, and the halving that came from finding the right one
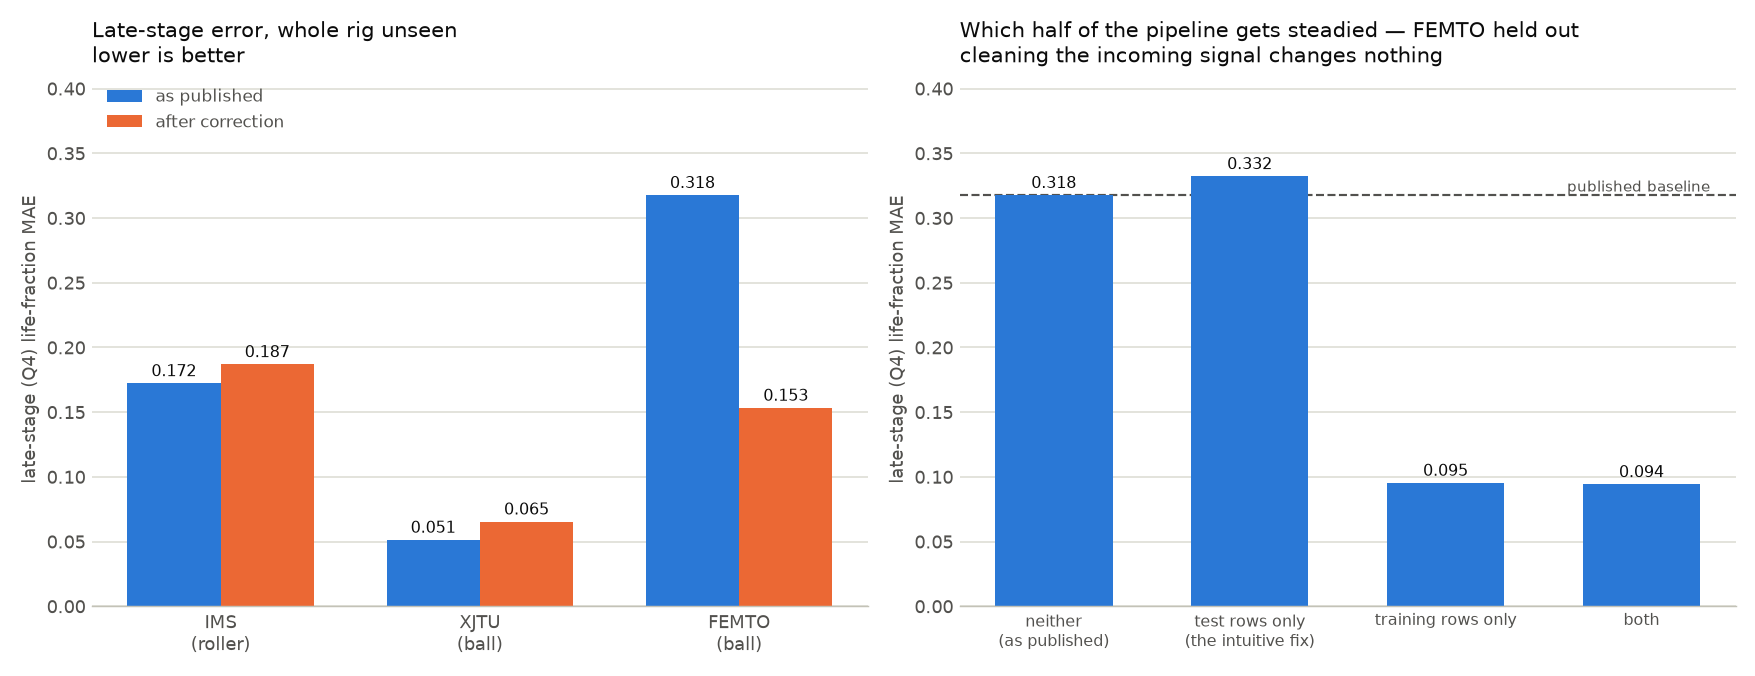
This page blamed FEMTO's difficulty on its finger-snap recordings.
The obvious remedy follows from that: steady the incoming readings
before judging them — take the middle of the last five instead of
reacting to each one. That was tested directly, along with the same
treatment applied to the textbook cases instead. The result inverts
the intuition.
| What gets steadied | Late-stage error | Verdict |
|---|
| Nothing — as originally published | 0.318 | baseline |
| The incoming FEMTO readings | 0.332 | slightly worse |
| The training examples | 0.095 | 70% better |
| Both | 0.094 | no better than training alone |
Cleaning the patient's chart does nothing. Cleaning the textbook
fixes almost everything. The mechanism: when the worked examples
jump around, the model learns the jumping instead of the underlying
decline — it fits measurement scatter belonging to those particular
rigs. Steady the examples and it learns the real shape of failure,
after which it reads a messy new signal perfectly well with no
cleanup at all. Train someone on blurry textbook photographs and
they learn the blur; sharpening the patient's X-ray afterwards
cannot undo that.
It hits FEMTO hardest for an unglamorous reason. Holding FEMTO out
leaves the smallest pile of examples to learn from — 4,610 rows,
against 14,220 and 15,536 for the other two rotations. Scarce
examples is precisely when a model memorises noise, so cleaning them
up helps most exactly there. This is regularisation, not
denoising — and it means the original diagnosis, "FEMTO is hard
because its recordings are poor," was describing a symptom. The
recordings really are poorer. But most of the penalty came from the
model, not the microphone.
One more confession, because it changes which number belongs in a
summary. That 0.095 was obtained with a steadying amount picked
after seeing how each option scored against the held-out
rig — which is peeking, and it flatters the result the way
calibrating a scale against the object you are about to weigh
flatters the reading. Redone strictly — the amount chosen using only
the rigs the model trains on, the held-out rig touched exactly once
at the end — late-stage error lands at 0.153. Still
a 52% cut against 0.318, and that is the figure worth quoting. The
gap between 0.153 and 0.095 has a cause worth stating too: the
setting has to be chosen from the rigs you can see, and those are
precisely the ones that don't need it. You cannot tune a
noise-handling knob for a machine you have not met.
What it improved
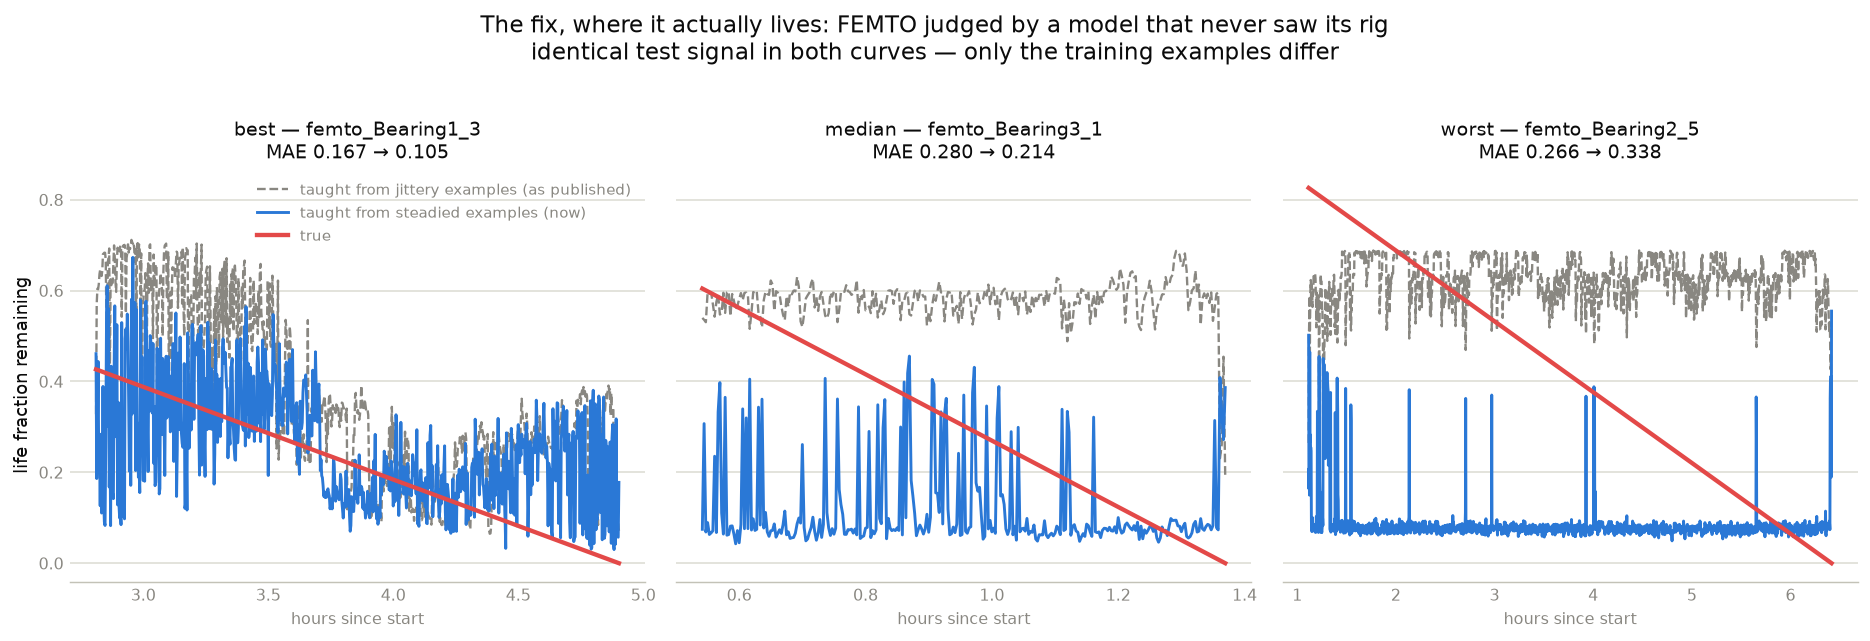
The same fix, shown where it actually operates. Every curve here is a
FEMTO bearing judged by a model that never saw its rig. The test
signal is identical in both lines — raw, untouched — so the
only thing separating them is what the model was taught from. Grey
learned from jittery examples; blue learned from steadied ones. Watch
the grey line in the middle and right panels: it parks near 0.6 and
stays there, calmly reporting most of a life remaining while the
bearing dies underneath it. Blue follows the truth down. Across all
seventeen FEMTO bearings the median error falls 0.249 → 0.214 and the
late-stage error halves, 0.318 → 0.153; the biggest single winner
goes 0.409 → 0.107.
The right-hand panel is there deliberately, because a median hides a
lot: 7 of the 17 bearings got worse, one of them
badly (0.103 → 0.307). The worst case shown is one of the losers —
0.266 → 0.338 — and you can see what happened to it: blue now pins
near zero for the whole run, calling the bearing nearly dead from the
start. So the honest description is not "the model got better" but
"the model traded one failure for another". It was uniformly too
optimistic; it is now sometimes too pessimistic. On a machine you
would actually act on, that is a different mistake rather than an
obviously smaller one. The median improved, the character of the
errors changed, and both belong in the summary.
What did not improve
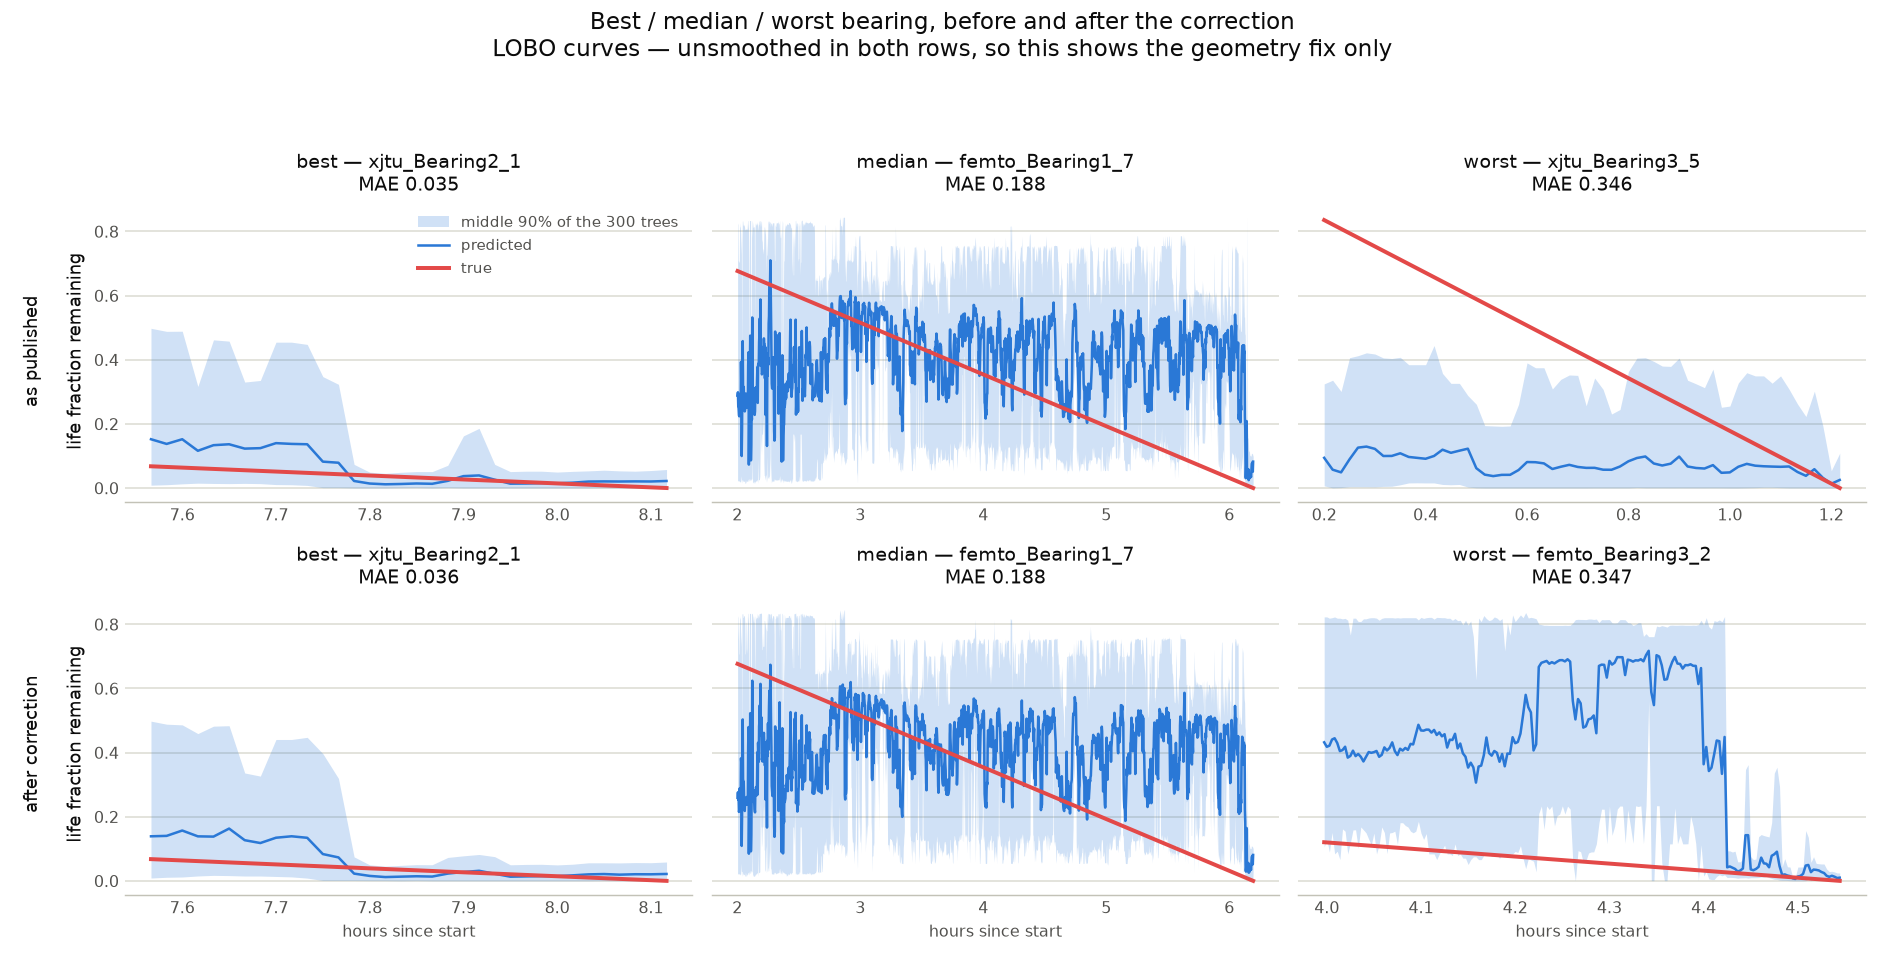
The clearest picture of a correction that changed nothing. Best and
median are the same bearing in both rows, with curves you
cannot tell apart — which is exactly right, because these are the
bearing-unseen curves and that protocol is deliberately left
unsmoothed. Only the worst slot changes hands, and only because two
bearings swapped rank by four thousandths. The fix that halved
FEMTO's late-stage error lives in the whole-rig-unseen protocol and
is invisible here; the chart above is where you see it.
Four things were untouched by all of this, and pretending otherwise
would undo the point of the exercise. Steadying the examples
does nothing when a sibling bearing is available — tested
directly, the bearing-unseen exam moved by 0.002, which is nothing;
the benefit exists only when an entire rig is a stranger, which is
admittedly the case that matters, and it is why that protocol is
left unsmoothed. IMS got marginally worse
(0.160 → 0.187). FEMTO's frequency
resolution is permanent: no processing recovers detail a
0.1-second recording never captured. And "failure time" is
still a chosen convention, FEMTO's failure modes are still
undocumented, and 36 lifetimes is still a small number. The honest
summary is that one large error was cut by about half, one caveat
was retired, one explanation was wrong, and everything else on this
page stands as it was.