Data / ML project · Jul 2026

Predicting bearing failures from vibration data.

The NASA/IMS dataset ran bearings to actual failure: 3 tests, 4 bearings each, 2000 RPM under 6000 lbs radial load, accelerometers sampled at 20 kHz. A healthy bearing hums quietly; once a crack forms on a race, every ball passing over it produces a sharp impact. This project turns that physics into a working early warning system — first with classical statistics, then with machine learning — and grades both against the documented teardowns.

4/4failed bearings detected — matched NASA's teardown in every test
2.5–17 daysearly warning before functional failure (the P–F interval)
5.5 hbest failure-date forecast error, on a 45-day test
7.4 hML mean error in the final 24 h, on a bearing it never trained on
Method

Three steps, from raw signal to a countdown.

Step 1 · FeaturesCompress the signal

Each 10-minute snapshot (20,480 points per channel) is reduced to four health numbers: RMS (overall energy, the ISO 10816 standard), kurtosis (spikiness — impacts push it above the Gaussian value of 3, usually the earliest warning), peak, and crest factor.

Step 2 · Detect & forecastStatistics, no ML

The first 15% of each test is certified healthy. Smoothed RMS crossing baseline + 6σ for 5 consecutive snapshots raises the alarm. From then on, an exponential fit to the damage growth is extrapolated to the failure level — repeated at every snapshot, so the forecast sharpens like a hurricane track.

Step 3 · Machine learningRandom forest RUL

5,296 snapshots from the failed bearings of tests 1–2 become training examples: "vibration looked like this → death in X hours". Features are normalized to each bearing's own healthy baseline so the model learns damage patterns, not bearing identities. It is graded on test 3 — a bearing it never saw.

Results

The plots are the outcome.

One bearing takes off, three stay flat

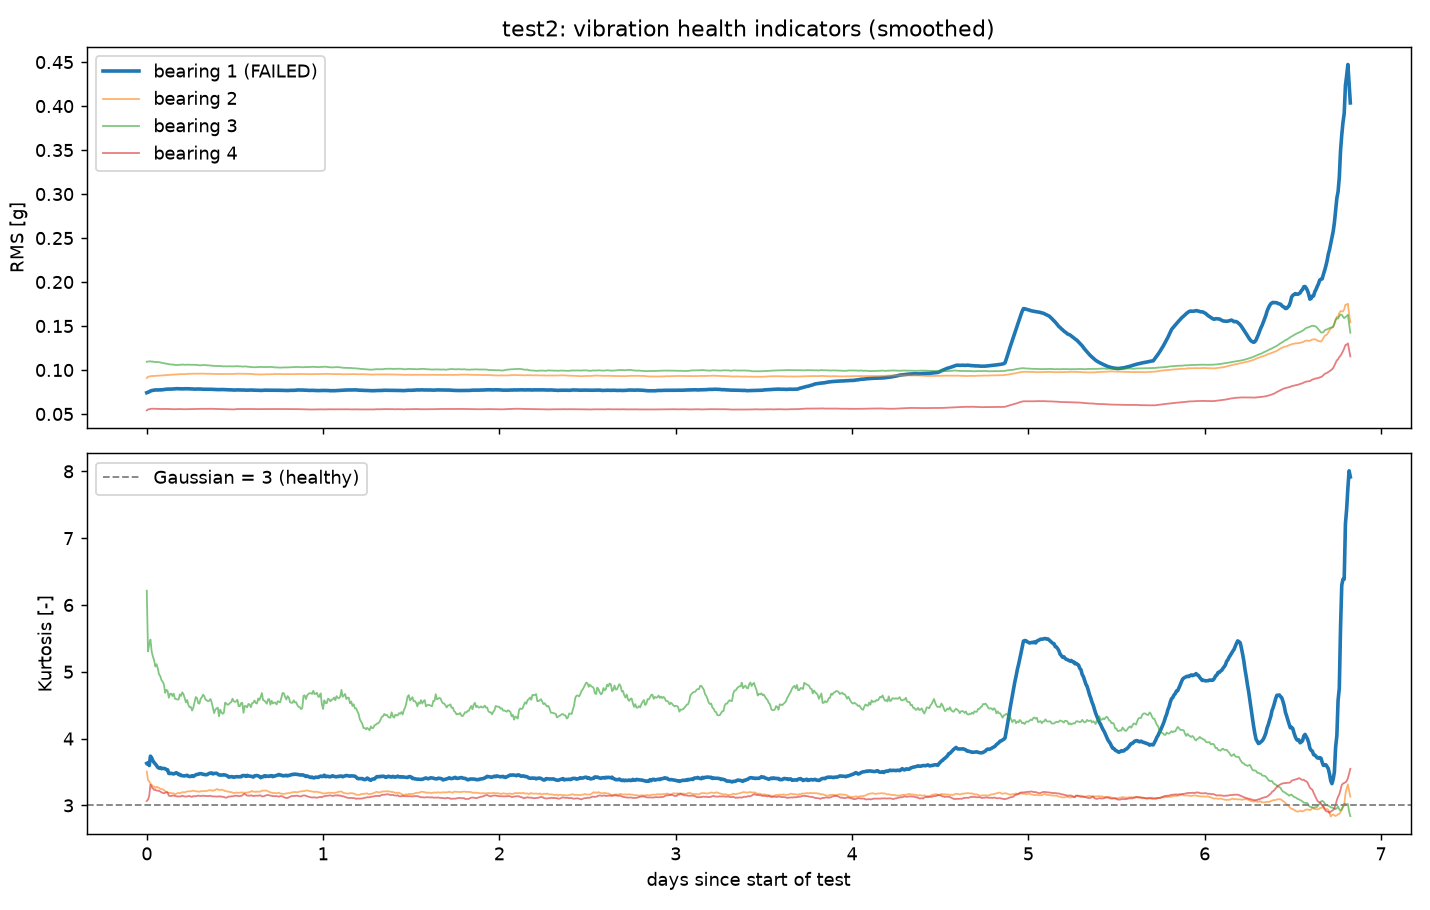
Test 2 overview: RMS and kurtosis of all four bearings; bearing 1 rises sharply near day 7 while the others stay flat

Test 2, all four bearings. Bearing 1 (outer race defect) leaves the healthy band around day 4 and accelerates to failure at day 6.8 — exactly the bearing NASA's teardown found spalled. The other three hum along at their baselines the whole week.

Detection + a converging failure forecast

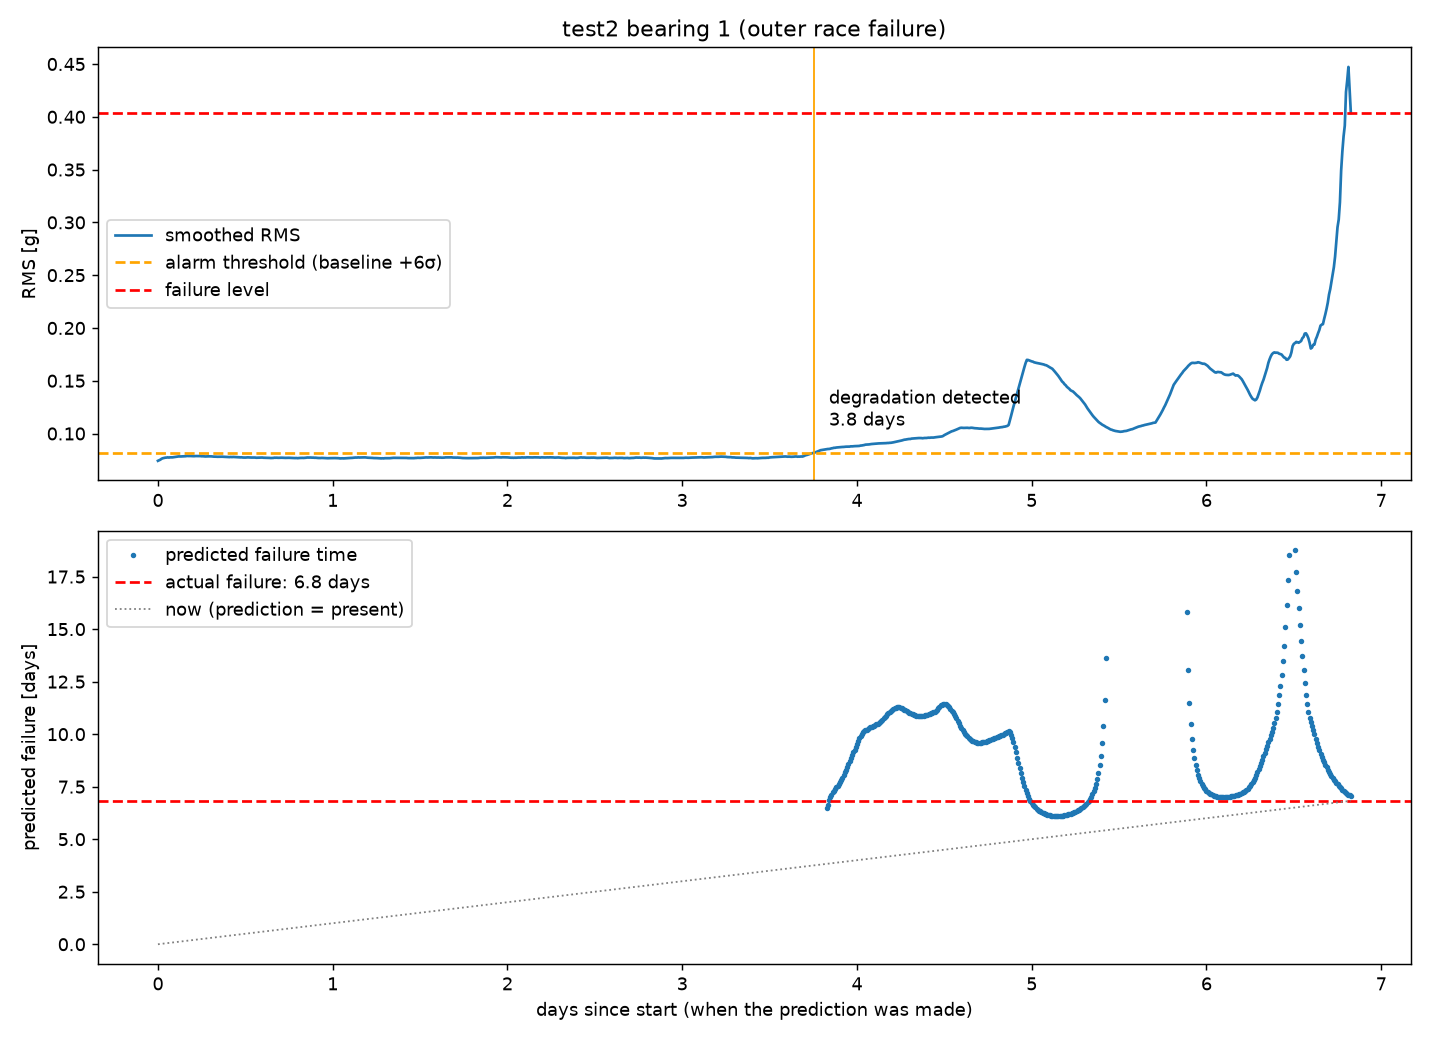
Test 2 bearing 1: degradation detected at 3.8 days; predicted failure dates converge onto the actual failure at 6.8 days

Top: the alarm fires at 3.8 days — 3 days before failure. Bottom: standing at each day, the exponential fit predicts the failure date (blue dots); as damage grows the prediction converges onto the truth (red line), like a hurricane forecast cone narrowing.

The famous "healing" bearing

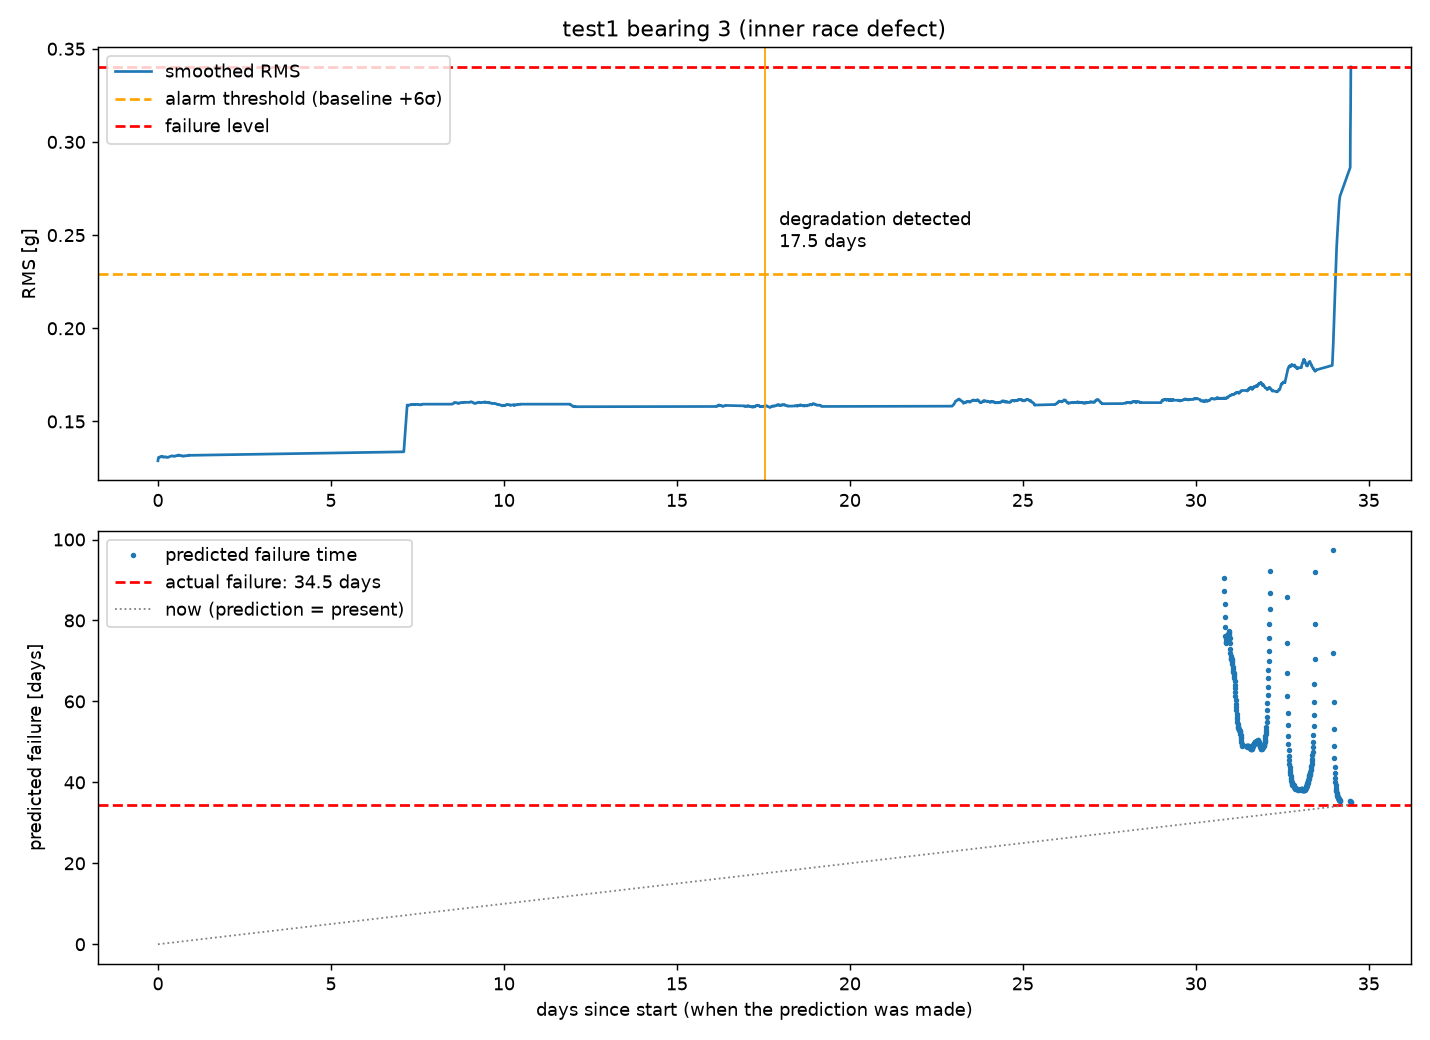
Test 1 bearing 3: health curve temporarily recovers before worsening, making early forecasts wander before converging

Test 1 bearing 3 temporarily "heals" — the spall edges get smoothed over before the damage resumes — so early forecasts wander before converging. A good reminder that degradation is physics, not a tidy exponential.

Random forest on a bearing it never saw

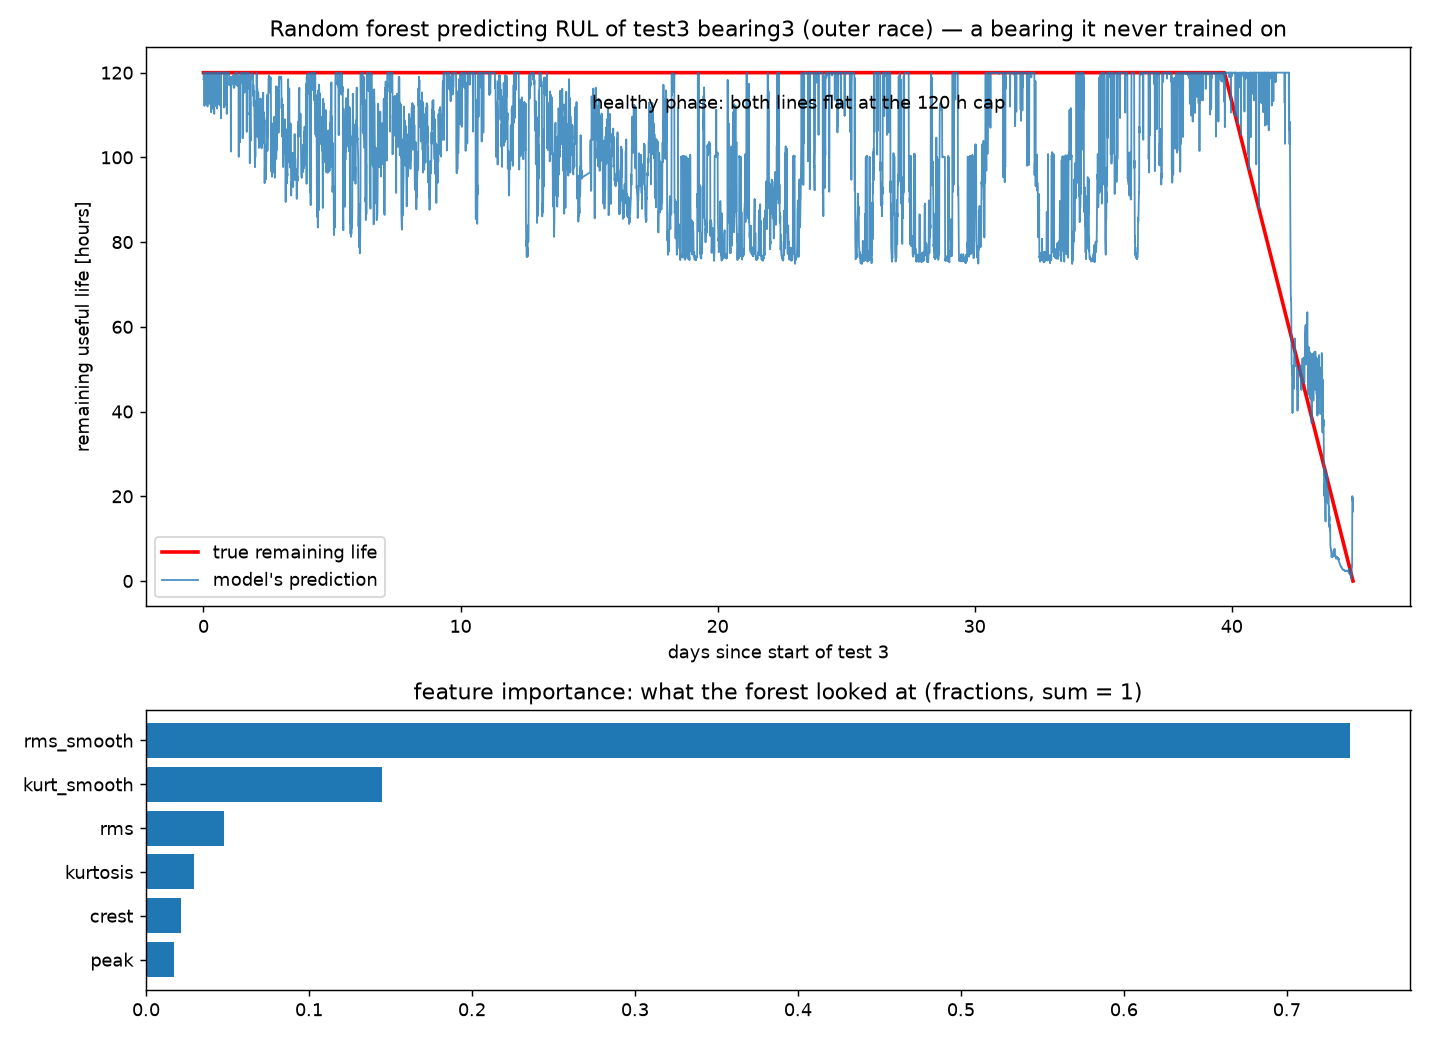
Random forest predicting remaining useful life of test 3 bearing 3, versus the true remaining life; feature importance dominated by smoothed RMS

The model predicts remaining useful life hour by hour on test 3. Labels are capped at 120 h because healthy vibration carries no information about the future — the flat red line is honesty, not a bug. Once degradation starts near day 40, the countdown locks on: mean error 7.4 hours over the final day. Feature importance puts ~75% on smoothed RMS and ~15% on smoothed kurtosis — the forest independently rediscovered the indicators the physics suggested.

Honest limitations

Where the countdown stops — and what Part 2 did about it.

Read Part 2 — does it transfer to an unseen rig? →

Materials

Slides and write-up.

The full walkthrough — method, plots, and the ML explained from a mechanical engineer's point of view — is in the presentation.